Getting started with QAPlug:
- Code Review
- Creating your own analysis profile
- Import and export analysis profiles
- QAPlug actualization
- How to activate on-the-fly checks (QAPlug Real-Time Analysis) using QAPlug inspection
- Integrating Sonar with QAPlug
Code Review
To make a review of your code using QAPlug, first you have to select the scope.
Please select file, package or the whole directory by right mouse click.
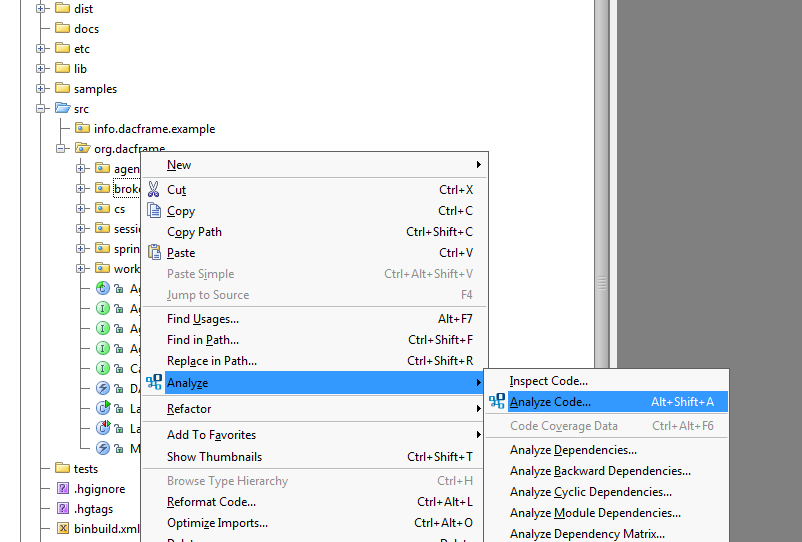
In a new window an appropriate analysis scope will be selected
You will be also able to change analysis profile which you want to be used.
![]()
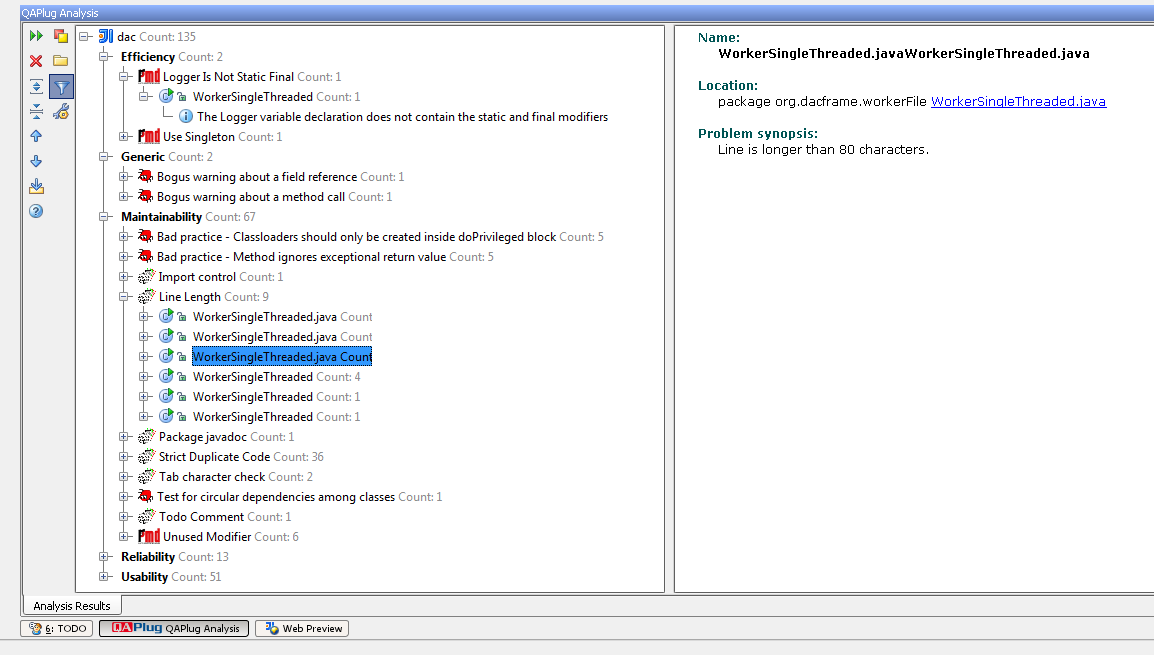
The results of the analysis will be presented in a separate window with flexible grouping functionality.
Creating your own analysis profile
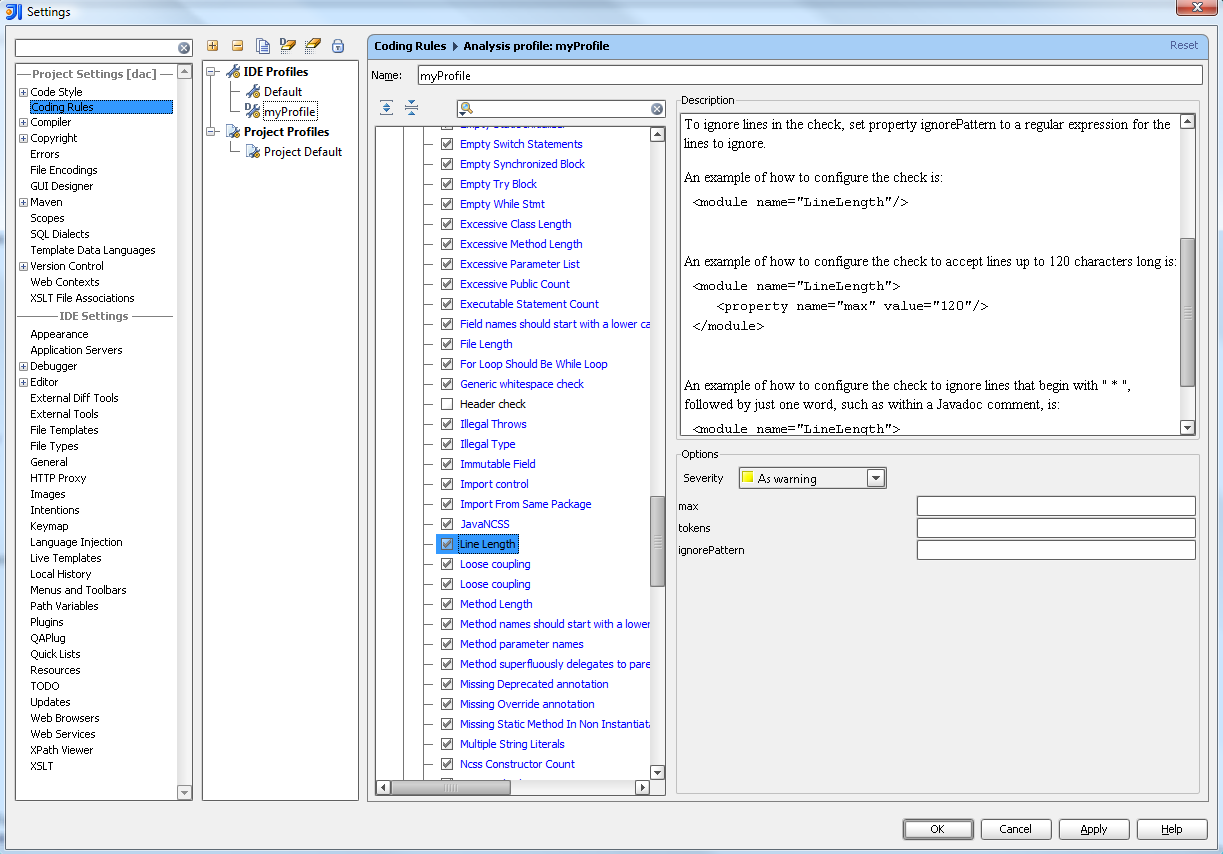
You can create your own scanning profile in QAPlug Coding Rules window.
(Main menu: Settings | Coding Rules ).

You are also able to fill specific parameters of the coding rules options.
Import and export analysis profiles
Import and Export options you can find in Coding Rules settings tab (please see picture below).
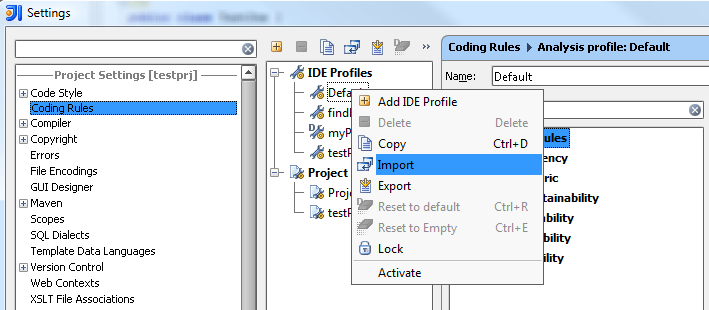
You are able to import several coding rules configuration files (eg. Checkstyle, PMD, FindBugs) to one profile simply be repeating import action.

You are also able to export your analysis profile to xml configuration file.
Please notice that you are able to decide which modules will be exported.
Generated file format depends on the selected modules.
If you want to use generated file in your own tool (FindBugs, PMD, Checkstyle, Sonar, etc.) without any modifications, then you should select only one module at once.

QAPlug actualization
You can check if QAPlug and its submodules are up to date in QAPlug Settings window.
(Main menu: Settings | QAPlug).
![]()
How to activate on-the-fly checks (QAPlug Real-Time Analysis) using QAPlug inspection
If you want to use QAPlug on-the-fly checks functionality in your IntelliJ IDEA, please
do not forget to activate QAPlug Real-Time Analysis inspection.
Below you can find picture presenting how to do that:
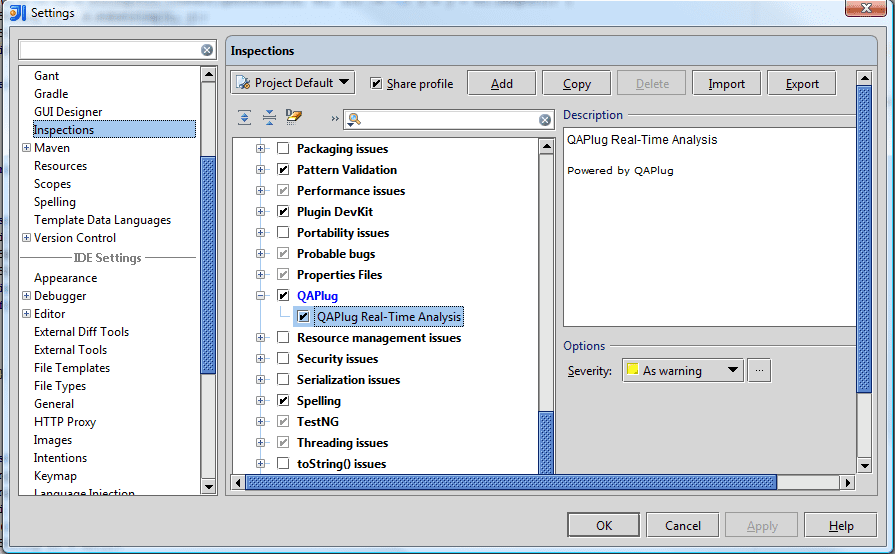
Please remeber that QAPlug Real-Time Analysis is using Default Project profile.
If you want to change this profile, please use Coding Rules settings tab.
After that step, changes done by you in the code will affect results of the analysis.

Integrating Sonar with QAPlug
This tutorial shows you how to transfer coding rules configured in Sonar into QAPlug.
Sonar is an open source quality management platform, dedicated to continuously analyze and measure source code quality. It allows you to analyze code using the most popular coding rules like: Checkstyle, Findbugs and PMD.
Usually, the Sonar code analysis is performed only once or twice a day. What about the situation when we need a real time analysis?
In this case we can use QAPlug and import coding rules from Sonar.
See how to do that in the steps below:
1. Open Sonar in your web browser.

2. Click on ‘Log in’ button to get access to configuration area.

3. After login, click on ‘Configuration’ button to set your customized coding rules.

4. Click on your profile name. (in this case ‘Mifos’).

5. Modify some rules options and confirm changes using ‘Update’ button.

6. Click on ‘Home’ button to return to projects page.

7. Click on project name to check errors in code.
Note: To see modified settings in code rules you should rebuild project(using for example command: mvn sonar:sonar).

8. In Sonar ‘Dashboard’ area, select severity of previously modified rule.

9. In ‘Violations Drilldown’ area select modified rule and check error in code.

10. Now you’ve checked that modified rules are properly working in Sonar.
The next thing to do is to export that modified rules into QAPlug. To do that you can use Permalinks.
11. Return to ‘Configuration’ area and select your profile.

12. Now, go to ‘Permalinks’ tab.

13. In ‘Permalinks’ tab, right-click on link for chosen coding rule and select ‘Save target as…’

14. Save permalink as .xml file.
Now, you have finished all tasks in Sonar. So, the next step is to open IntelliJ IDEA.
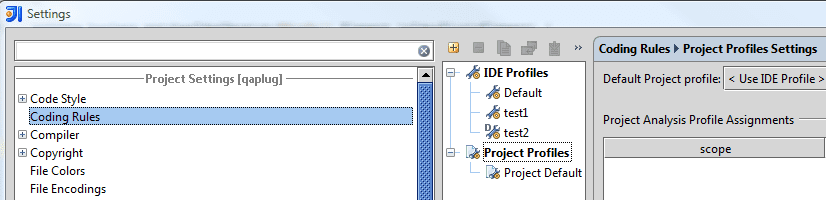
15. In open IDEA window, go to Settings → QAPlug.

16. Click on ‘Coding Rules’.

17. Right-click on ‘Project Profiles’ and select ‘Add Project Profile’.

18. In the ‘New Profile’ window,
- fill the profile name,
- check ‘Import profile’ checkbox,
- select location of the exported file from Sonar
- confirm creation of the new profile by clicking on ‘OK’ button.

19. After successfull profile import, the summary window will appear.

20. The last step is to check in code that imported rules are working properly. So, open project and analyze code using QAPlug.

Now, you have imported coding rules from Sonar. From this moment, you can check the written code on-the-fly and fix errors right away!
Please have in mind that we are planning to simplify and extend the integration of Sonar with QAPlug in the future.